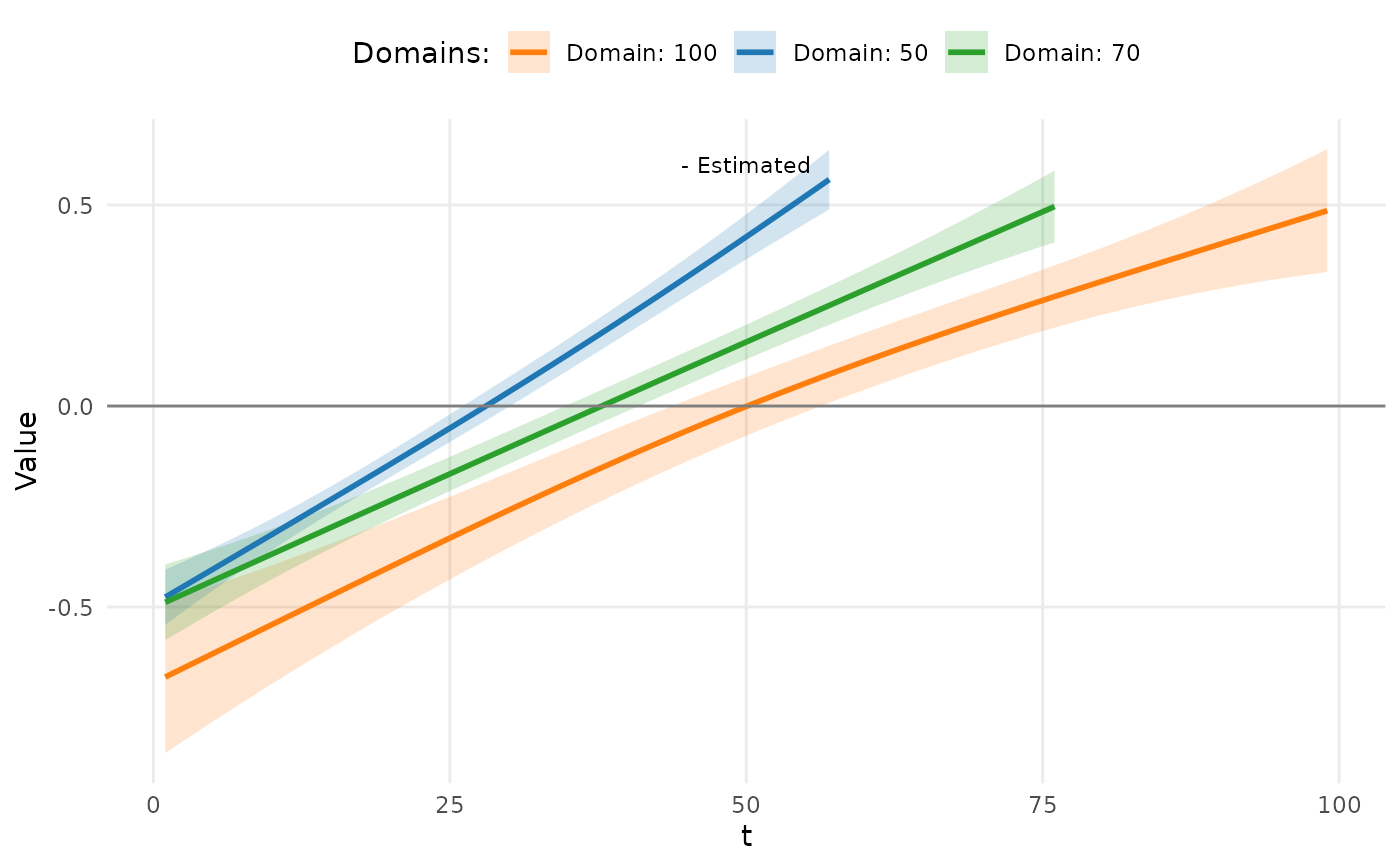
Plot Functional Curves with Confidence Intervals
plot_ci.RdGenerates a plot of functional Beta estimates for specified curves, along with their 95% confidence intervals. This function computes the 95% confidence intervals for each curve based on the covariance matrix and the fitted values from the provided object. The resulting plot includes estimated curves, confidence interval ribbons, and a legend distinguishing the curves.
Value
A ggplot2 object displaying the Beta estimates and confidence intervals for the specified curves.
Examples
# \donttest{
if (requireNamespace("ggplot2", quietly = TRUE)) {
  # set seed for reproducibility
  set.seed(42)

  # generate variable domain functional data and fit the model
  data <- data_generator_vd(N = 100, J = 100, beta_index = 1)
  res <- vd_fit(y ~ ffvd(X_se, nbasis = c(10, 10, 10)), data = data)

  # plot the estimated coefficient and its confidence intervals
  # for a selection of curves
  plot_ci(res, beta_index = 1, curves = c(50, 70, 100))
}
#> Warning: Using `size` aesthetic for lines was deprecated in ggplot2 3.4.0.
#> ℹ Please use `linewidth` instead.
#> ℹ The deprecated feature was likely used in the VDPO package.
#>   Please report the issue to the authors.

# }
# }